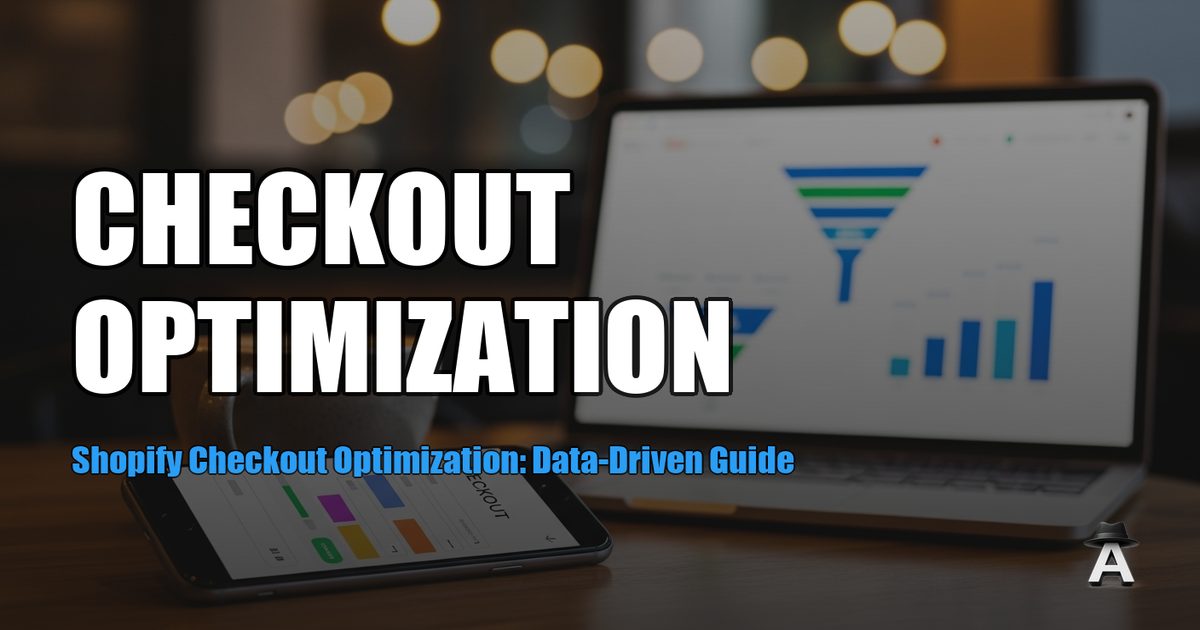
Your checkout is the final gate between a browsing session and revenue. Every friction point here costs real money.
Consider the math: a store with 5,000 monthly begin_checkout events and a 45% checkout completion rate generates 2,250 orders. Improving that completion rate to 50% adds 250 orders per month with zero additional traffic or ad spend. At a $100 AOV, that is $25,000 in monthly revenue from checkout optimization alone.
This guide covers what to optimize, how to measure the impact, and what Shopify actually lets you change on standard vs. Plus plans. For the broader conversion optimization framework, see our Shopify conversion optimization analytics guide.
Measure Your Checkout Performance First
Before optimizing anything, establish your checkout conversion rate.
Checkout completion rate formula:
Checkout Completion Rate = (Purchases / Begin Checkout Events) x 100
This is different from your overall site conversion rate. Your site conversion rate includes all sessions. Checkout completion rate only measures visitors who started checkout. This is the metric that tells you how well your checkout performs.
Set Up GA4 Checkout Funnel Tracking
In GA4, navigate to Explore > Funnel Exploration and create this funnel:
- add_to_cart -- visitor adds a product
- begin_checkout -- visitor starts checkout
- add_shipping_info -- visitor enters shipping details
- add_payment_info -- visitor enters payment
- purchase -- order completed
This funnel reveals exactly where people leave. If 30% drop between add_to_cart and begin_checkout, the problem is before checkout (shipping cost surprise, cart page friction). If 20% drop between add_payment_info and purchase, the problem is at the payment step.
If your GA4 events are not firing correctly, start with our GA4 setup for Shopify guide. Missing events mean missing data, and you cannot optimize what you cannot see.
Checkout Benchmarks
| Metric | Average | Good | Top Performers |
|---|---|---|---|
| Checkout completion rate | 45-50% | 55-65% | 70%+ |
| Cart-to-checkout rate | 30-40% | 45-55% | 60%+ |
| Mobile checkout completion | 35-42% | 48-55% | 60%+ |
| Desktop checkout completion | 50-58% | 62-70% | 75%+ |
The mobile-desktop gap in checkout is even wider than in overall conversion. Mobile checkout completion often trails desktop by 15-20 percentage points. Fixing this gap is one of the highest-ROI checkout improvements.
Mission Briefs include a Funnel Report that tracks these metrics weekly, showing exactly where your checkout funnel drops off. No manual funnel exploration required.
💡 Pro Tip: Analytics Agent automatically tracks all these metrics for you. Install Analytics Agent and get instant insights without the manual work.
Shopify Checkout: What You Can and Cannot Change
Shopify controls the checkout experience more tightly than any other part of your store. What you can change depends on your plan.
Standard Shopify Plans
You control:
- Logo and branding colors
- One-page vs. three-page checkout layout
- Express checkout methods (Shop Pay, Apple Pay, Google Pay, PayPal)
- Guest checkout toggle
- Tipping options
- Order notes
- Email/SMS marketing opt-in
You cannot change:
- Checkout page layout or field order
- Form field requirements (beyond what Shopify provides)
- Custom scripts or third-party apps in checkout
- Payment page design
Shopify Plus
Plus unlocks Checkout Extensibility, which allows:
- Custom UI components in checkout
- Post-purchase upsell pages
- Custom validation rules
- Branded checkout domains
- Checkout scripts for discounts and logic
The honest take: Most standard-plan stores have enough optimization levers to significantly improve checkout performance. Plus checkout customization matters most for stores processing 1,000+ orders per month where small percentage improvements translate to large absolute numbers.
10 Checkout Optimizations Ranked by Impact
1. Enable Shop Pay
Impact: 72% higher checkout completion vs. guest checkout
Shop Pay is the single highest-impact checkout optimization available to any Shopify store. Shoppers with a Shop Pay account complete checkout with one tap. Their shipping address, email, and payment information are pre-filled.
The data: Shop Pay delivers an average 9% lift in conversion across all checkouts. For returning customers, the lift is 18%. On mobile specifically, Shop Pay achieves 1.91x higher checkout-to-order rate.
Setup: Settings > Payments > Shopify Payments > Manage > Enable Shop Pay.
Measure: In GA4, segment checkout completion rate by payment method. Compare Shop Pay completions vs. guest checkout completions.
2. Add Express Checkout Options
Impact: 10-15% reduction in checkout abandonment
Apple Pay, Google Pay, and PayPal Express let shoppers skip the entire form-filling process. On mobile, where typing is the primary friction point, express checkout eliminates the biggest barrier.
Setup: Settings > Payments. Enable each express checkout option available in your region. The more options you offer, the higher the percentage of visitors who can use a pre-filled checkout.
Measure: Track the percentage of orders completed via express checkout methods. A rising percentage indicates adoption. Compare checkout completion rates for express vs. standard checkout.
3. Switch to One-Page Checkout
Impact: 7.5-20% checkout completion improvement
Shopify's one-page checkout consolidates shipping, payment, and review into a single scrollable page. This reduces clicks, eliminates page loads between steps, and lowers abandonment by up to 35%.
Setup: Settings > Checkout > Checkout layout > One-page checkout. Available on all Shopify plans since late 2023.
Measure: Compare checkout completion rate for 30 days before and after switching. The improvement is typically visible within the first week.
4. Enable Guest Checkout
Impact: 5-15% reduction in checkout abandonment
26% of shoppers abandon when required to create an account. For first-time visitors, forced registration is a conversion killer.
Setup: Settings > Checkout > Customer accounts > "Accounts are optional." Shoppers can still create an account after purchase.
Measure: Track checkout abandonment rate before and after. Also monitor account creation rate post-purchase to confirm you are not losing long-term customer data.
5. Optimize for Mobile Checkout
Impact: Variable, but mobile is 68% of traffic
Mobile checkout completion trails desktop by 15-20 percentage points for most stores. The causes: small tap targets, too many form fields on a small screen, slow loading, and difficulty correcting errors.
Key mobile checkout fixes:
- Ensure express checkout buttons are prominent and full-width
- Auto-detect address with Google Places API (Shopify supports this natively)
- Use numeric keyboards for phone and zip code fields
- Make error messages clear and positioned near the problem field
Measure: In GA4, compare checkout completion rate by device (mobile vs. desktop). Track the gap monthly. Your goal is to narrow it, not necessarily to equalize it.
See Analytics Agent in Action
Discover how AI-powered insights can transform your Shopify store.
6. Reduce Perceived Form Complexity
Impact: Up to 35% abandonment reduction
The average checkout has 11.3 form fields. Research shows that reducing the visible field count to 7 or fewer significantly reduces abandonment. Shopify's checkout already does this reasonably well, but you can optimize further.
Actions:
- Disable optional fields you do not need (company name, apartment line if not relevant)
- Enable address auto-complete
- Use smart defaults (pre-select the most common shipping method)
Setup: Settings > Checkout > Form options. Set unused fields to "Hidden."
Measure: Track the time-to-complete metric if available through your analytics, or track checkout completion rate changes.
7. Display Trust Signals at Checkout
Impact: 2-5% checkout completion lift
At the moment of payment, buyers need reassurance. Security badges, money-back guarantees, and clear return policies reduce last-second hesitation.
On Shopify, trust signals in checkout are limited on standard plans. You can:
- Add a refund policy link (automatically included)
- Enable the Shopify secure badge
- Customize the checkout footer with trust language
On Plus, you can add custom trust badge sections via Checkout Extensibility.
Measure: A/B test if possible (Plus only). Otherwise, compare checkout completion rate before and after adding trust signals.
8. Add Buy Now, Pay Later Options
Impact: BNPL increases checkout completion and AOV
Global BNPL payments are projected to surpass $560 billion by end of 2026. Offering BNPL removes the price objection at checkout. Research shows BNPL options increase checkout completion by 20-30% and lift AOV by 30-50%.
Setup: Settings > Payments. Enable Shop Pay Installments, Klarna, Afterpay, or Affirm depending on your market. Shop Pay Installments is the simplest option for Shopify stores.
Measure: Track average order value and checkout completion rate segmented by payment method. Compare BNPL orders vs. standard payment orders.
For more on AOV strategies at checkout, see our Shopify AOV optimization guide.
9. Optimize Payment Gateway Performance
Impact: 1-3% through reduced payment failures
Payment declines kill conversions silently. A customer fills out the entire form, clicks Pay, and gets declined. Most do not retry.
Actions:
- Ensure your payment processor supports 3D Secure 2.0 (reduces false declines)
- Test your checkout regularly with real transactions
- If you have high international sales, ensure your gateway supports local payment methods
- Monitor payment failure rates in Shopify Analytics
Measure: Track payment failure rate in Shopify > Analytics > Reports. Any rate above 2-3% warrants investigation.
10. Implement Post-Purchase Upsells
Impact: 5-15% revenue increase per order (without affecting checkout completion)
Post-purchase upsells appear after the payment is complete but before the thank-you page. Because the purchase is already done, there is zero risk to checkout completion. The customer simply adds to their existing order with one click.
Setup: Requires Shopify Plus with Checkout Extensibility, or a third-party app that supports post-purchase offers (ReConvert, AfterSell, Zipify OneClickUpsell).
Measure: Track upsell acceptance rate and revenue per upsell offer.
Payment Method Performance Data
Not all payment methods convert equally. Here is what the data shows:
| Payment Method | Checkout Completion Index | Best For |
|---|---|---|
| Shop Pay | 1.72x baseline | Returning customers, mobile |
| Apple Pay | 1.4-1.6x baseline | iOS/Safari users |
| Google Pay | 1.3-1.5x baseline | Android/Chrome users |
| PayPal Express | 1.2-1.4x baseline | High-trust transactions |
| Standard card entry | 1.0x (baseline) | First-time, low-trust sessions |
The takeaway: every express checkout option you enable captures a segment of shoppers who would otherwise abandon at the payment form.
Tracking Checkout Performance in GA4
Funnel Exploration Best Practices
When analyzing your checkout funnel in GA4:
-
Segment by device first. Mobile and desktop checkout experiences are fundamentally different. A blended funnel hides the real problems.
-
Segment by traffic source. Paid traffic often behaves differently than organic. If your paid campaigns drive high add_to_cart but low checkout completion, the problem might be audience targeting, not checkout design.
-
Compare time periods. After any checkout change, compare the same funnel for 30 days before vs. 30 days after.
-
Check for missing events. If your begin_checkout count seems low relative to add_to_cart, you may have a tracking issue rather than a checkout problem.
Key Metrics to Monitor Weekly
- Checkout completion rate: purchases / begin_checkout
- Cart-to-checkout rate: begin_checkout / add_to_cart
- Mobile vs. desktop checkout gap
- Express checkout adoption rate: Shop Pay + Apple Pay + Google Pay orders / total orders
- Payment failure rate
💡 Pro Tip: Analytics Agent automatically tracks all these metrics for you. Install Analytics Agent and get instant insights without the manual work.
Automate Checkout Monitoring
Checking these metrics manually each week is tedious and easy to skip. Mission Briefs include a Funnel Report agent that tracks your complete purchase funnel automatically.
Each week, the Funnel Report shows:
- Exact drop-off percentages at each funnel step
- Changes from the previous period
- Which step deteriorated (or improved) the most
If your checkout completion rate drops suddenly -- maybe a payment gateway issue, maybe a broken coupon code -- Anomaly Detection catches it before you lose a full week of conversions.
Understanding your cart abandonment patterns provides additional context for checkout optimization decisions.
Three Checkout Wins to Implement Today
- Enable Shop Pay -- five minutes of setup for the highest-impact single change
- Switch to one-page checkout -- one setting change for 7.5-20% improvement
- Set up GA4 checkout funnel tracking -- so you can measure every future optimization
Checkout optimization is not a one-time project. It is an ongoing practice of measuring, testing, and iterating. The stores hitting 70%+ checkout completion rates got there through systematic improvement, not a single magic fix.
Ready to Unlock Your Analytics Potential?
Connect Analytics Agent to your Shopify store and start making data-driven decisions today.
Get Started Free